Dynamic Debug
Requirements
Kernel build
For this part, we'll be performing dynamic debugging, which requires the kernel to be built with the following kernel config items1
CONFIG_DYNAMIC_DEBUG=y        # build catalog, enables CORE
CONFIG_DYNAMIC_DEBUG_CORE=y   # enable mechanics only, skip catalog
Kernel boot parameters
In the dynamic debug documentation referenced above, we can find all the information pertinent to setting up filters. Let's first start by searching the available function filters to find out whether or not we can debug the function we're interested. Every prompt shown from hereon out is assumed to be running as root
$ grep crb_map_io /sys/kernel/tracing/available_filter_functions
crb_map_io
Great! Looks like we can indeed debug that function. Let's go ahead and prepare the kernel parameters for dynamic debugging at boot-time
dyndbg="file tpm_crb.c +p" trace_buf_size=1M ftrace=function_graph ftrace_graph_filter=crb_map_io ftrace_boot_snapshot
Those parameters can be passed into your bootloader's configs; be it GRUB's /etc/default/grub (don't forget to update-grub after making changes to the file), or systemd-boot's /boot/efi/loader/entries/<machine-id>-$(uname -r).conf
I chose the function_graph tracer specifically because it's easier to follow from a strictly visual standpoint. ftrace_graph_filter=crb_map_io will only trace that one function in the tpm_crb.c file; this is extremely important so the tracer does not hook into every function that's executing (might severely degrade performance and/or cause lockups). ftrace_boot_snapshot will allow the tracer to hand over the call graph to the filesystem, which we will be using a text editor to view its contents at /sys/kernel/tracing/snapshot. Finally, the +p flag following the file match-spec enables the pr_debug() callsite. We are using it to see debug messages that would be otherwise hidden as per the kernel's default parameters
Post-reboot Analysis
After having committed our changes to the kernel command-line parameters and rebooted the system, it's time to analyze the function call graph. In Vim's command mode, we'll be executing the following: :set cc=25, and :hi ColorColumn guibg=DarkRed. This is simply to overlay a color column at the 25th column exactly; this is the level at which any function executing within crb_map_io is displayed in the call graph
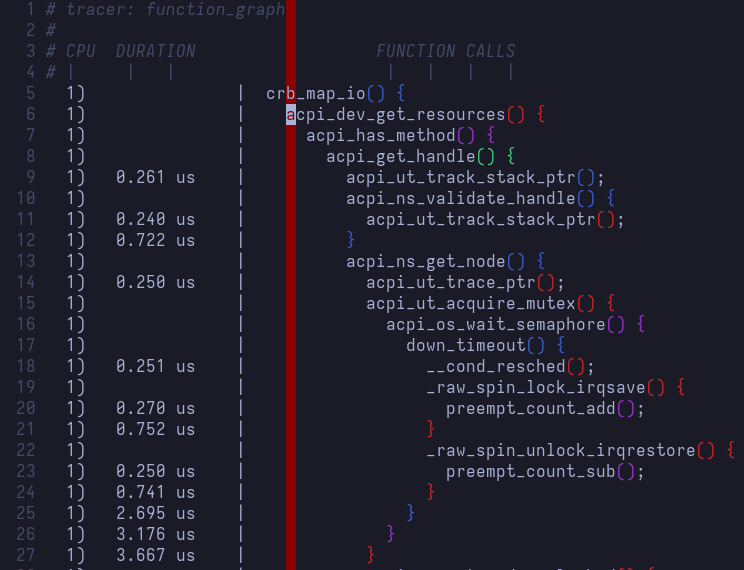
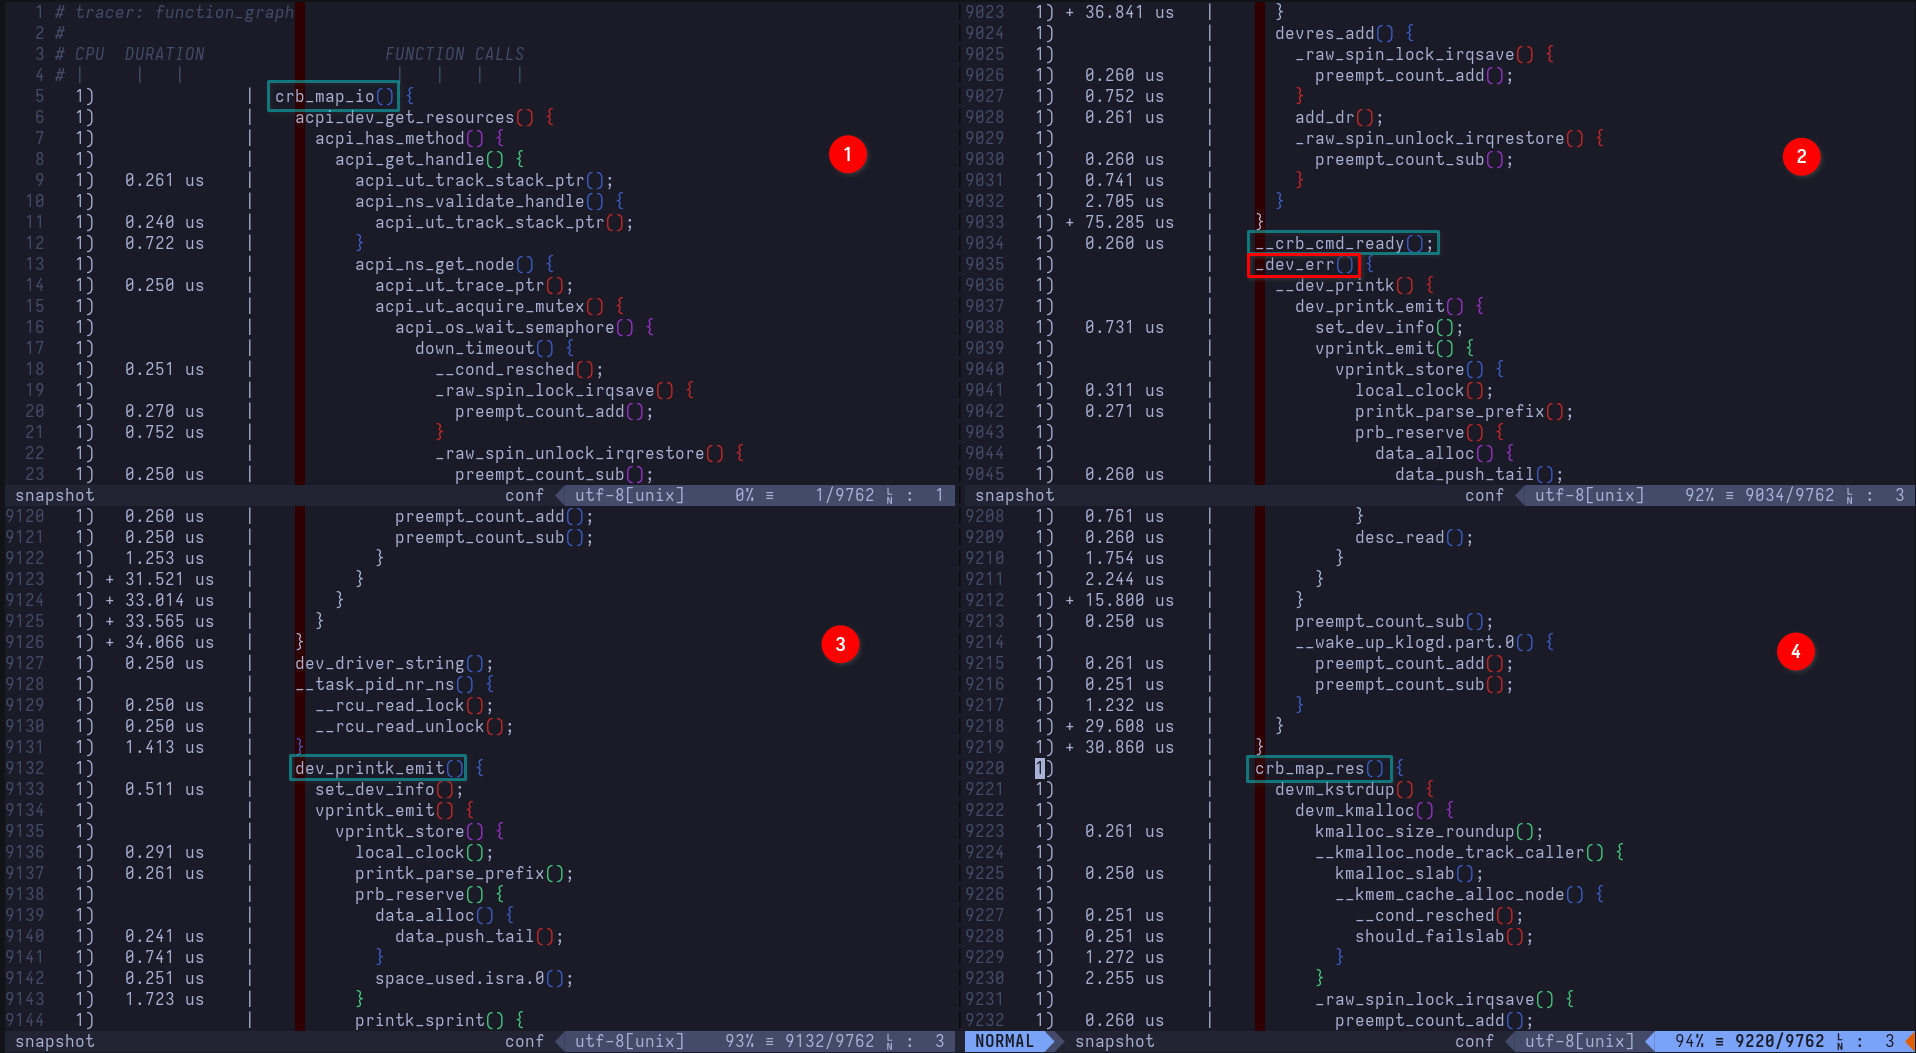
Now, this is an almost-10k-lines-long file, so we'll only be covering relevance as usual. As a reminder, we are looking for functions in the following order
1. crb_map_io()
2. __crb_cmd_ready()
3. _dev_err()
4. dev_printk_emit()
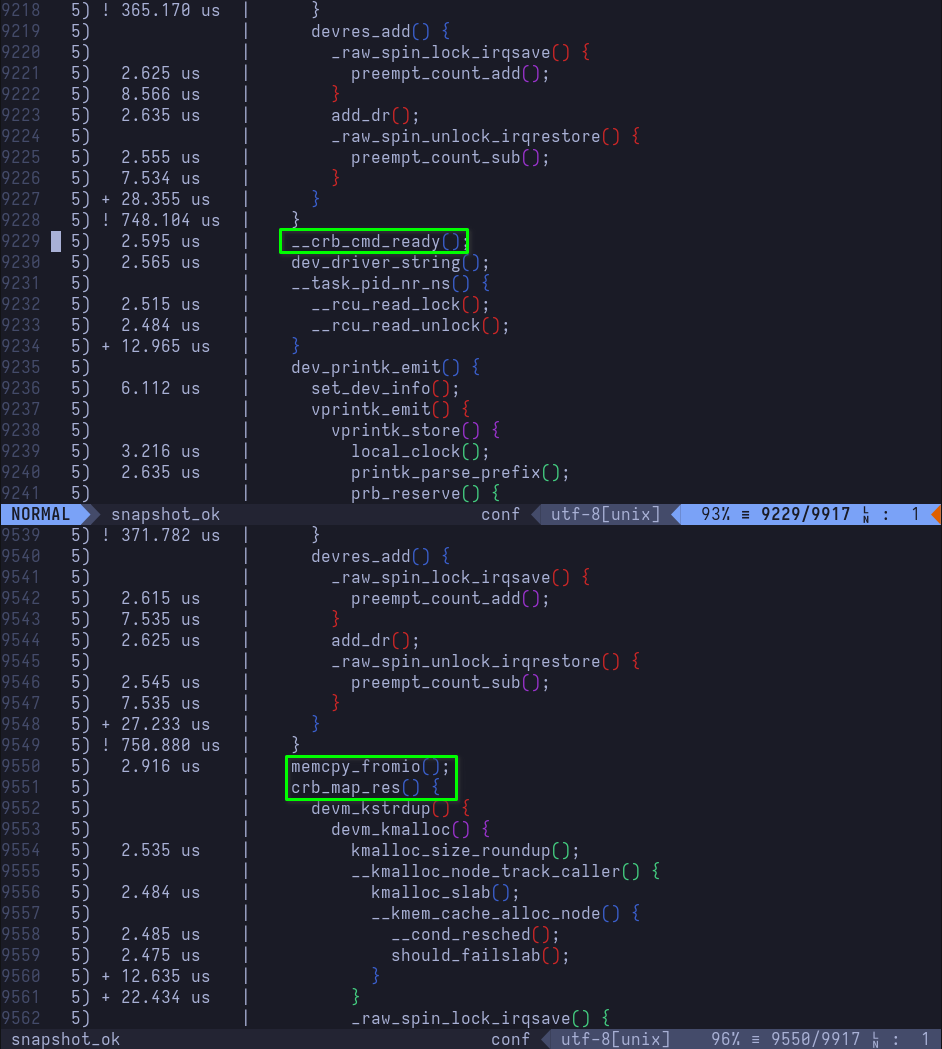
5. crb_map_res()
6. memcpy_fromio()
7. _dev_err()
8. crb_map_res()
I chose to split the same file multiple times in Vim so it's easier to follow. Normally, we'd be scrolling through/searching for the functions of interest. I also darkened the ColorColumn so it doesn't impact readability
Let's unpack:
crb_map_io()begins execution. This is the function we're tracing
2.1__crb_cmd_ready()executes, requesting tpm crb device to enter ready state
2.2_dev_err()executes (it's really a wrapper for printing device error-level messages), calling__dev_printk(), which ultimately ends up printing[Firmware Bug]: ACPI region does not cover the entire command/response buffer. [mem 0xbd6bb000-0xbd6bbfff flags 0x200] vs bd6bb000 4000to the kernel ring buffer. Remember, this is the called by the first call tocrb_fixup_cmd_size()which handles fixing up the command sizedev_printk_emit()executes, printing thedev_dbgmessagetpm_crb MSFT0101:00: cmd_hi = 0 cmd_low = BD6BB000 cmd_size 1000to the kernel ring buffercrb_map_res()executes, mapping the command response buffer's resources
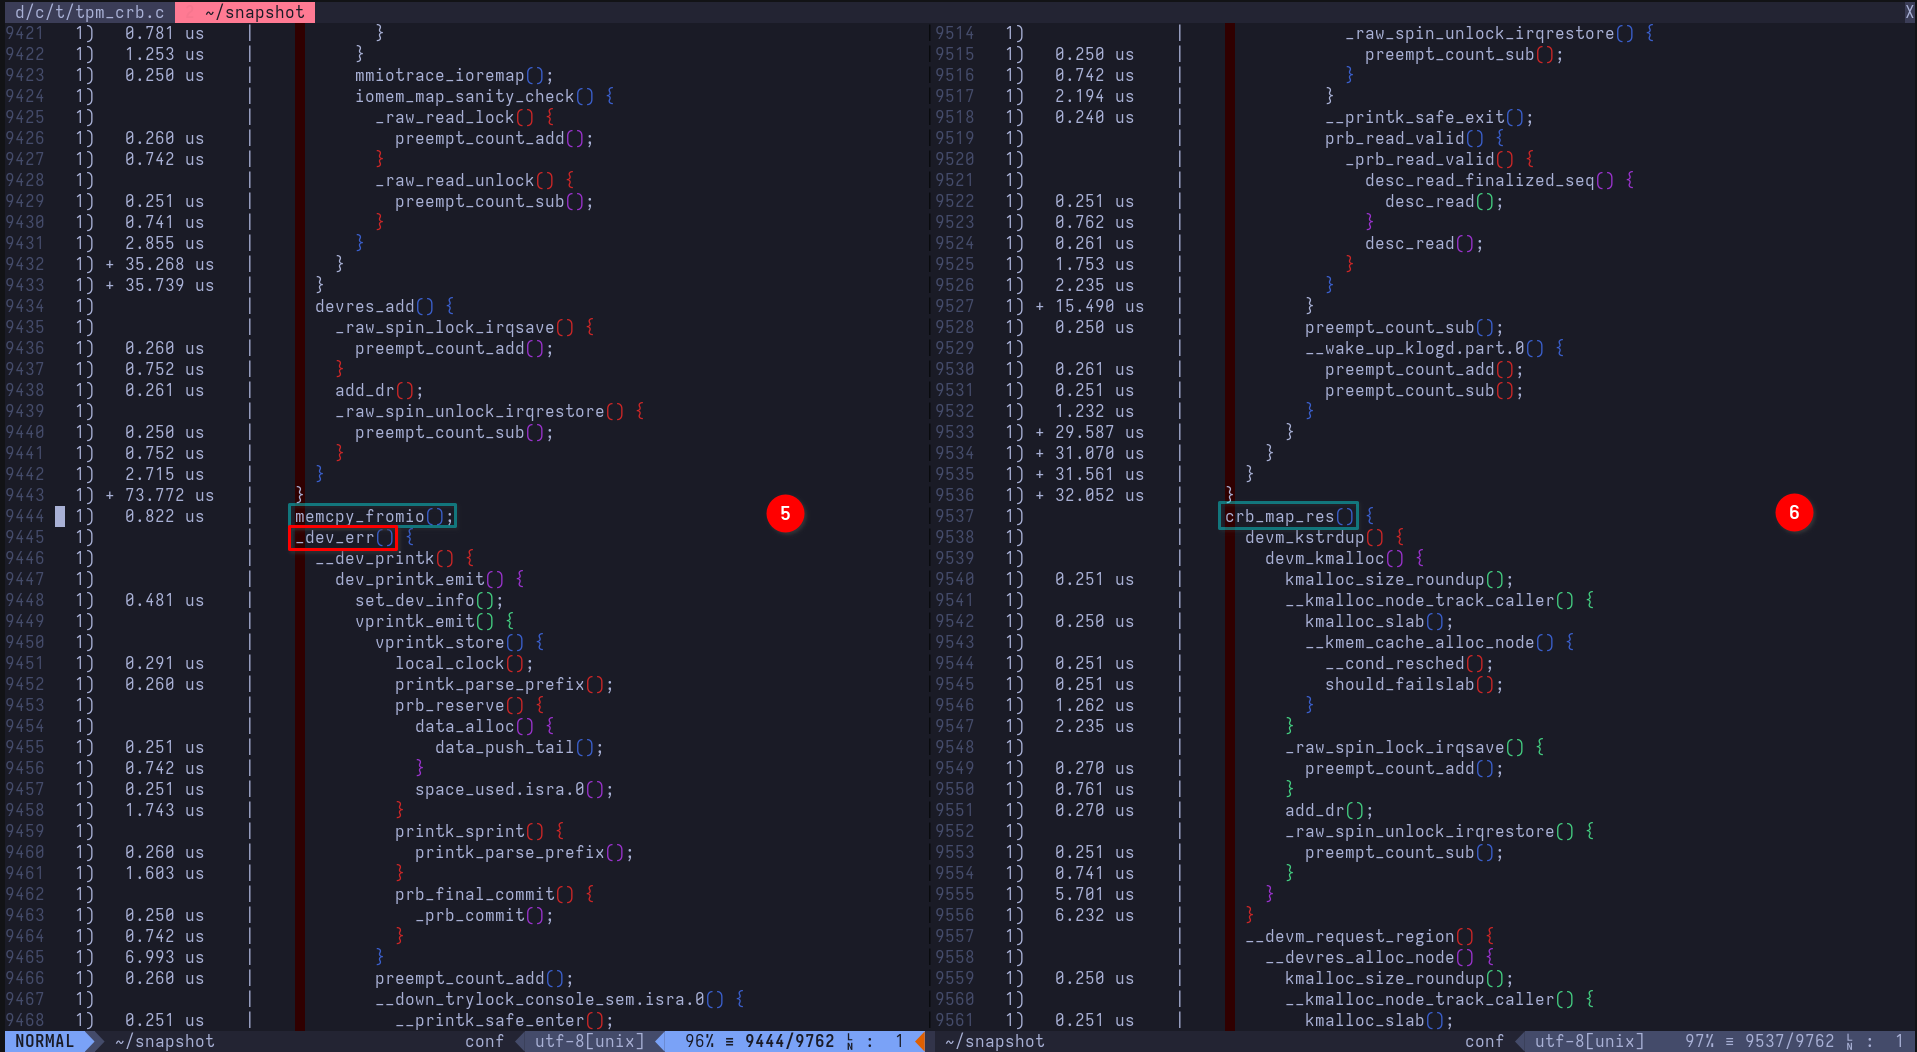
5.1memcpy_fromio()executes, copying memory area from IO for the response buffer
5.2_dev_err()executes, calling__dev_printk(), which ultimately ends up printing[Firmware Bug]: ACPI region does not cover the entire command/response buffer. [mem 0xbd6bf000-0xbd6bffff flags 0x200] vs bd6bf000 4000to the kernel ring buffer. Remember, this is the called by the second call tocrb_fixup_cmd_size()which handles fixing up the response sizecrb_map_res()executes, mapping the command response buffer's resources
Now, putting it all together, we have perspective
tpm_crb MSFT0101:00: [Firmware Bug]: ACPI region does not cover the entire command/response buffer. [mem 0xbd6bb000-0xbd6bbfff flags 0x200] vs bd6bb000 4000

tpm_crb MSFT0101:00: cmd_hi = 0 cmd_low = BD6BB000 cmd_size 1000

tpm_crb MSFT0101:00: [Firmware Bug]: ACPI region does not cover the entire command/response buffer. [mem 0xbd6bf000-0xbd6bffff flags 0x200] vs bd6bf000 4000
It all makes sense now! Command size is 1000 (remember: Store (0x1000, LTFB)) as declared/modified by ACPI, versus what the register reports back; 4000. Now, if you think the fix should be simple enough, you're on the right track. Instead of allocating 0x1000 (4.00 KiB) for the command and response buffers, we should really allocate 0x4000 (16.00 KiB). Let's go ahead and modify that in DSDT's _SB.TPM._CRS (or _SB.TPM.CRST and remove runtime modifications executed in _SB.TPM._CRS)
The Fix
Method (_CRS, 0, Serialized)  // _CRS: Current Resource Settings
{
    If (LEqual (AMDT, One))
    {
        CreateDWordField (CRST, \_SB.TPM._Y20._BAS, MTFB)  // _BAS: Base Address
        CreateDWordField (CRST, \_SB.TPM._Y20._LEN, LTFB)  // _LEN: Length
        Store (TPMB, MTFB)
-       Store (0x1000, LTFB)
+       Store (0x4000, LTFB)    /* Fix up command size */
        CreateDWordField (CRST, \_SB.TPM._Y21._BAS, MTFC)  // _BAS: Base Address
        CreateDWordField (CRST, \_SB.TPM._Y21._LEN, LTFC)  // _LEN: Length
        Store (TPMC, MTFC)
-       Store (0x1000, LTFC)
+       Store (0x4000, LTFC)    /* Fix up response size */
        Return (CRST)
    }
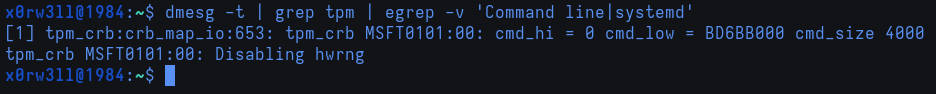
Bump the OEMRevision, compile the newly modified table, copy the compiled table into kernel/firmware/acpi, create the cpio archive, copy it over to /boot/efi/EFI/acpi/acpi.cpio, and reboot. With dynamic debugging still enabled, we can verify whether or not our fix actually worked. Grepping the kernel ring buffer for the firmware bug will not return anything. Grepping for cmd_size, however, will now show tpm_crb MSFT0101:00: cmd_hi = 0 cmd_low = BD6BB000 cmd_size 4000! Looking at the new /sys/kernel/tracing/snapshot will reveal that _dev_err() calls were never made (_dev_err() is the byproduct of calling crb_fixup_cmd_size() to print the error-level message)
This concludes addressing TPM! We've not only managed to address an issue at a lower level, but we've also learned a bit of debugging along the way